Time trends between number of COVID-19 Clinical Trials and COVID-19 new cases
There has been a large amount of trials implemented in different areas of the country, we don’t know if the start of these trials preceeded the rise in cases.
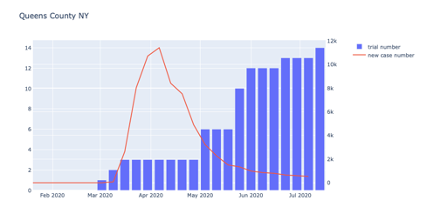
Like in NYC, it had the first case on March 1st, and on April 6th the city had its highest day of cases. Some trials were able to enroll patients prior to the height of cases in NYC, many of the trials did not open until after April 6th.
We want to evaluate the time trends between the number of cases and the timing of clinical trials to see the response.
Here are two animation for trials and new cases.
- Animation for COVID-19 related open trials across the US from February to June
- Animation for COVID-19 weekly new case numbers across the US from January to June
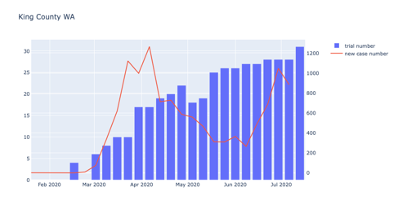
At the beginning of the pandemic in the US, NYC and Seattle experienced high numbers of cases relative to the rest of the country. It is evident that the peak of the new case number preceded the rise in clinical trials, especially present in Queens County.
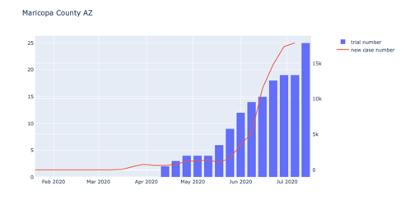
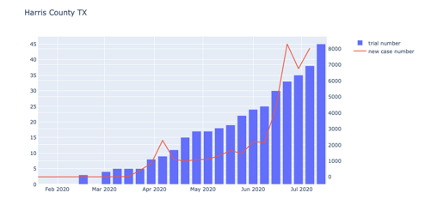
In contrast, the following two plots display different trends. Cases in Phenix and Dallas did not start to increase until about June. They had more clinical trials available to enroll patients in.